But how widespread is urea overuse? The yearly fertilizer consumption numbers provided in the Pakistan Statistical Yearbook by PBS and in the Annual Economic Survey are the go-to reference for most scholarly analyses of fertilizer usage.
By Minahil Adil
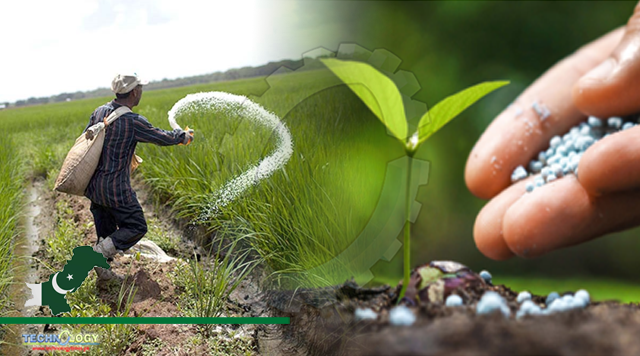
It is commonly acknowledged that fertilizer use in Pakistani agriculture is heavily biased toward urea application. After all, the bulk of Pakistan’s small-scale and subsistence farmers can’t afford high-value fertilizers like DAP and nitro phosphates. The credo among the country’s innovative farmers is that the key to unlocking goal crop yields is an optimal ratio, not a maximal application.
But how widespread is urea overuse? The yearly fertilizer consumption numbers provided in the Pakistan Statistical Yearbook by PBS and in the Annual Economic Survey are the go-to reference for most scholarly analyses of fertilizer usage.
According to government figures, four primary crops — wheat, cotton, sugarcane, and rice – absorb up to 90% of yearly fertilizer offtake, with wheat accounting for half of that.
Wheat is by far the most important crop, accounting for 9 million hectares out of a total planted area of 22.5 million hectares, thus that argument has long been taken for granted. Furthermore, because fertilizer offtake is evenly distributed throughout the Kharif and rabi seasons, it is anticipated that wheat accounts for over 95 percent of fertilizer offtake during rabi, according to monthly numbers given by the National Fertilizer Development Corporation (NFDC).
Many environmentalists make conclusions about an “excessive fertilizer (urea) usage and cash crop cultivation nexus” based on the aforementioned relationship, which is difficult to refute given that the four cash crops continue to account for 70% of the total agricultural area farmed. Would farming a more diversified mix of higher-value crops, on the other hand, result in lower fertilizer use?
But before that, a quick note on national fertilizer use statistics.
The yearly estimates released by PBS and others are based on NDFC’s Fertilizer Use Survey from 2005, which implies 50% fertilizer use for wheat, 25% for cotton, 8% for sugarcane, and 6% for rice, with the remaining 11% for other crops.
That assumption is quite dubious. According to the report, cotton fertilizer usage grew by 17% between FY10 and FY19, despite the fact that the area under cotton production decreased by almost 1 million hectares. Could it be that cotton farmers are adding incremental amounts of fertilizer season after season, only to have their yields decline?
Similarly, despite the fact that Pakistan’s maize output has increased in the previous decade, maize fertilizer use remains low. Is it true that increasing maize output does not necessitate the use of extra fertilizer?
The agriculture department of the Punjab government disagrees. While it is hard to estimate crop-specific fertilizer usage due to the lack of periodic/annual research, indicative/recommended fertilizer application amounts (provided by the Punjab government) can provide some information.
When Punjab’s prescribed fertilizer amounts are taken into account, the absolute conclusions do not alter substantially. Wheat, after all, would continue to be the top fertilizer consumer – at 42 percent – due to the vastness of its cultivation. Is it, however, the most fertilizer-intensive?
It turns out that if recommended fertilizer amounts per hectare were implemented, important crops including wheat, seed cotton, and rice would rarely be among the top ten fertilizer consumers. (The volume of fertilizer applied per unit area is referred to as fertilizer-intensiveness.)
In both urea and DAP, the most fertilizer-intensive crops are vegetables such as potato, tenda, bitter gourd, and tomatoes, with sugarcane and maize also ranking among the top ten.
So, how can the two sets of data be reconciled? Because it is based on outdated information and thus does not take into consideration changing farmer preferences for crops, or higher fertilizer application in extremely prevalent crops such as sugarcane and corn, it’s really reasonable to conclude that the 2005 NDFC survey could then be jettisoned and not included in revered official publications such as Economic Survey.
Meanwhile, based on both old and new data, rice stands out as a significant exception as a low-fertilizer heavy crop. The lower recommended amount of urea and DAP treatment per unit area in the Punjab government’s newest figures attests to this reality, as does the low fertilizer consumption of rice even in the 2005 survey. Wheat, on the other hand, is the sole constant.
As the crop that covers 90% of the rabi season crop area, it continues to be the source of disproportionate urea application, which is projected to be 53% more than required!
Of course, the information must be handled with caution. After all, data on fertilizer consumption amount applied per unit area represents suggested levels rather than actual levels. As a result, both normative and reported inputs have a role in the gap between recommended and actual fertilizer use during any given season.
Furthermore, if the recommended fertilizer application volume for each crop differs by location, extrapolating Punjab’s results to the rest of the country might be problematic. However, it raises the question of whether promoting the growing of high-value crops to lessen reliance on fertilizer-intensive wheat and cotton may genuinely result in decreased fertilizer use.
Originally published at Daily times